Measuring Social Media Success: Proven Strategies to Track KPIs
We all love seeing the follower count climb and the likes roll in. It’s a nice ego boost, but let's be real—those numbers don't pay the bills. True social media success isn't about popularity contests. It’s about proving how your efforts are actually helping the business, whether that’s by generating leads, building customer loyalty, or driving sales. When you track the right Key Performance Indicators (KPIs), you can finally show the real, tangible value of your work.
Moving Beyond Likes to Measure What Actually Matters

It’s easy to get caught up in follower counts, but that’s not the whole story. The real trick to social media marketing is connecting the dots between your posts and the company's bottom line. This means you have to stop chasing surface-level numbers and start digging into what the data is really telling you.
What "success" looks like is completely different for every business. If you run an e-commerce brand, you’re probably obsessed with sales and conversion rates. But a B2B company? They’re likely more focused on getting qualified leads and demo requests. There's no one-size-fits-all answer.
First Things First: Define Your Purpose
Before you even think about opening an analytics dashboard, you have to ask one simple question: "What are we actually trying to do here?" If you can’t answer that, you’re just collecting data for the sake of it. The best measurement strategies always start with clear, specific goals.
So, what are you aiming for? Your goals might be to:
- Increase Brand Awareness: Get your name in front of the right people.
- Drive Website Traffic: Funnel interested users from your social channels directly to your site.
- Generate New Leads: Collect contact info from people who might become customers.
- Boost Brand Engagement: Create a vibrant community that talks back and shares your content.
- Improve Customer Satisfaction: Use social media as a fast and effective customer service channel.
The only metric that matters is the one that directly reflects your main business goal. Don't get distracted by what's popular—always bring it back to what you’re trying to achieve.
Once you know your primary objective, you can start pinpointing the specific metrics that will show if you're on the right track. This is the secret to measuring social media success without losing your mind. Be intentional.
Think about it this way: a local coffee shop trying to get more people through the door should be tracking things like location tags, check-ins, and engagement on posts about their new seasonal latte. A massive tech corporation, however, will care more about its Share of Voice and how its brand sentiment stacks up against the competition. It’s all about tailoring your approach to measure what truly matters for your business.
Connecting Your Goals to the Right KPIs
Let's be honest: tracking social media metrics without a clear goal is like driving without a destination. You’re just burning gas and collecting numbers that don't mean anything. For your data to have any real value, you have to connect it directly back to your business objectives.
An e-commerce store trying to sell more products will care about a completely different set of numbers than a B2B software company looking for qualified leads. Their versions of "success" are worlds apart. The trick is to start with your main business goal and work backward.
If your big-picture goal is to increase revenue, your social media focus shouldn't be on how many followers you have. Instead, you'd be laser-focused on metrics like Conversion Rate, Social Media Referral Traffic, and how many people are hitting "Add to Cart" from your posts. Your entire content plan should be designed to push those specific numbers up.
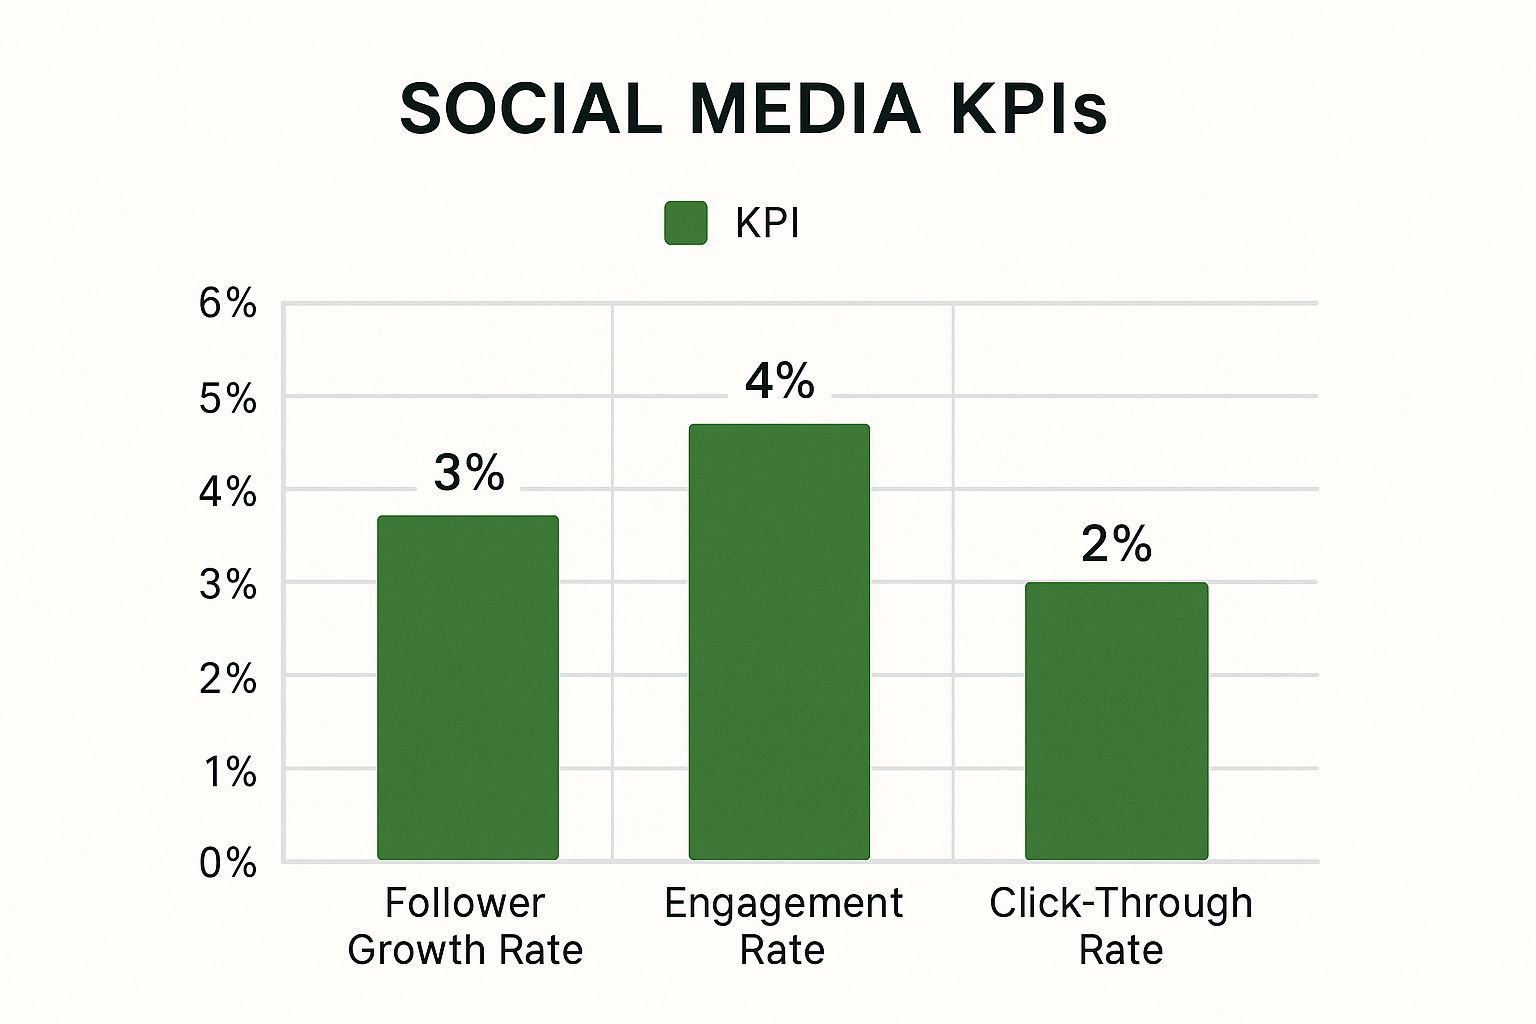
This image really breaks down the common metrics that brands look at to see what's working and what's not.

As you can see, success isn't just one number. It's a mix of metrics that tell a story about how your audience is growing, interacting with your brand, and ultimately, taking action.
Mapping Goals to Every Stage of the Journey
You also need to think about where your audience is in their journey with you. You can't expect someone who just found out you exist to immediately buy something. Your KPIs need to match their current stage.
Awareness Stage: The goal here is simple: get seen. The KPIs that matter are Reach (how many unique people see your content) and Impressions (how many times your content is shown). A spike in brand mentions is another great sign you're cutting through the noise.
Consideration Stage: Okay, they know who you are. Now what? You want them to engage. This is where metrics like Engagement Rate (your likes, comments, and shares) and Click-Through Rate (CTR) become your best friends. A high Video Completion Rate also tells you that your content is genuinely holding their attention.
Conversion Stage: This is where the magic happens. You want your audience to take a specific, valuable action. Success here is measured by hard numbers like Lead Generation (think newsletter sign-ups from your link-in-bio) or direct Social Commerce Sales.
To really see how this works, let's look at how different business goals translate into the social media metrics you should be tracking.
Mapping Business Goals to Social Media KPIs
| Business Goal | Primary Social Media Objective | Example KPIs |
|---|---|---|
| Increase Brand Awareness | Expand reach and visibility | Reach, Impressions, Audience Growth Rate, Share of Voice |
| Generate Leads | Capture contact information from interested users | Leads Generated, Cost Per Lead (CPL), Gated Content Downloads, Form Fills |
| Drive Website Traffic | Send users from social media to your website | Clicks, Click-Through Rate (CTR), Social Referral Traffic |
| Boost Sales & Revenue | Encourage direct purchases through social channels | Conversion Rate, Revenue from Social, Average Order Value (AOV) |
| Improve Customer Loyalty | Build a strong, engaged community | Engagement Rate, Customer Testimonials, User-Generated Content (UGC) |
A B2B software company might pour its energy into getting webinar sign-ups from a campaign on LinkedIn, making that a core conversion KPI. Meanwhile, a fashion brand will live and die by the sales it generates through Instagram Shopping. The platforms and tactics are different, but the core idea is the same: always match your KPIs to your goals.
If you want to dig even deeper, we have a complete guide on how to choose the right social media KPIs for your specific business.
Don't just track a KPI because it's popular. Always ask yourself: "If this number goes up, am I actually closer to my business goal?" If the answer is no, you're chasing a vanity metric.
It's also crucial to remember how people actually use social media. The average person juggles around 8 different social networks and spends nearly 2 hours and 20 minutes on them every single day. As you can see from these social media usage stats on Blog2Social, your audience is getting hit with messages from all sides.
This is why choosing the right metrics is so important. It helps you move from simply being on social media to making a real, measurable impact.
Picking the Right Analytics Tools for the Job

Alright, you’ve set your KPIs. Now for the crucial part: actually tracking them. This is where the right analytics tool comes in, turning a mountain of raw data into clear signals that tell you what’s working and what isn't.
But let’s be honest, the sheer number of tools available can feel a bit much. The good news? You don’t always need the fanciest, most expensive platform. The best tool for you really boils down to your team's size, your budget, and the specific goals you’re trying to hit.
Let's walk through the main options you'll encounter.
Starting with Native Platform Analytics
Every single major social network—we’re talking Instagram, Facebook, TikTok, LinkedIn, you name it—has its own free, built-in analytics dashboard. For day-to-day insights, these are surprisingly powerful.
- Who they're for: Small teams, solo entrepreneurs, or anyone just dipping their toes into social media measurement.
- The upside: They cost nothing, are incredibly easy to use, and give you the essential metrics like reach, engagement rate, and follower growth straight from the source.
- The downside: You have to log in and pull data from each platform one by one, which gets old fast. They also don't offer the horsepower for deep-dive competitive analysis or clean, cross-channel reports.
Think of native tools as your daily health check. They’re perfect for answering quick questions like, "How did that video I posted yesterday do?" or "When are my followers actually online?"
Leveling Up with All-in-One Management Platforms
When you're ready to get serious about measuring social media success, it's time to look at an all-in-one platform. Tools like Sprout Social, Hootsuite, or our own Publora platform are game-changers. They pull all your data from every network into one streamlined dashboard.
Your ability to measure social media success is only as good as the tools you use. Investing in the right platform can transform disjointed data points into a clear, actionable strategy for growth.
These platforms are often the command center for your entire social media operation, combining scheduling and publishing with powerful analytics. You can finally build custom reports, track campaigns across all your channels, and spot trends over time without juggling a dozen browser tabs. For a deeper look at the options out there, check out our guide to the best social media analytics tools on the market.
Gaining an Edge with Advanced Social Listening Tools
For brands that are laser-focused on brand health and keeping a close eye on the competition, social listening tools like Brandwatch are the gold standard. These platforms go way beyond just your own profiles to monitor what people are saying about you across the entire internet.
This is a big deal, especially when you consider that people spend a collective 14 billion hours a day on social media. Tapping into those conversations is incredibly powerful. In fact, marketing teams using social listening tools are often twice as confident in their ability to prove ROI. You can read more about these social media statistics and their implications on Talkwalker.
Social listening helps you find untagged brand mentions, analyze the sentiment behind conversations, and calculate your "share of voice" against your competitors. It moves beyond simple content performance to answer the big-picture questions about how your brand is truly perceived in the wild.
How to Find the Story Hidden in Your Data
Raw numbers are just noise. A spike in impressions or a dip in engagement tells you what happened, but the real magic is in figuring out why. This is where you graduate from simply reporting metrics to actually finding the story in your data—the key to truly measuring your social media success.
Let's be real: looking at isolated numbers is a waste of time. A high engagement rate is great, but what if it's coming from a tiny, irrelevant audience? On the flip side, a lower engagement rate with a super-targeted, niche audience could be a goldmine for your business. It's all about context.
Imagine your engagement rate suddenly cratered by 15% last month. A basic report just states the fact. A real analysis, however, digs in and asks the tough questions to uncover the narrative behind that number.
Diagnosing a Drop in Performance
When a key metric takes a nosedive, don't panic. Put on your detective hat. It's time to look for clues that explain what's going on.
Start by slicing up your data to isolate the problem. Ask yourself a few things:
- Was the drop on one specific platform? Maybe engagement tanked on Instagram but held steady on LinkedIn. That could point to an algorithm change or a shift in how your audience is using that network.
- Did certain content types flop? Perhaps your video views are solid, but your carousel posts suddenly aren't getting any love. Now you know exactly where to adjust your content mix.
- Did you change your posting schedule? If you started posting less often or at different times of the day, you might be missing your audience when they're most active.
By zeroing in on the variable, you go from a vague problem ("our engagement is down") to a specific, actionable insight ("our Instagram carousels are tanking on weekday afternoons"). Now that is something you can actually fix.
A metric without context is just a number. The story emerges when you compare data over time, segment your audience, and analyze performance across different content types and platforms.
Comparing Data for Deeper Insights
Finding the story isn't just about spotting problems; it's also about uncovering opportunities. To do that, you need to look at your data from a few different angles. This is where the strategic gold is buried.
One of the most powerful things you can do is benchmark against yourself. Is a 2% click-through rate good? Well, compared to last quarter's 1.5%, it's a huge win and shows your new call-to-action strategy is paying off.
You should also see how you stack up against the competition. A follower growth of 1% month-over-month might feel slow. But if your top three competitors are only growing at 0.5%, you’re actually leading the pack. This gives you a realistic view of where you stand in your industry. If you want to get better at uncovering patterns and making smart choices from your metrics, check out this practical guide to analyzing marketing data for data-driven decisions.
Ultimately, turning raw numbers into a story just takes a bit of curiosity. Keep asking "why?" and "so what?" until you have a clear, data-backed narrative that can steer your next move and prove how valuable your work really is.
Turning Insights Into Action and Growth

Here's where the rubber meets the road. All the data in the world is useless if you don't use it to make smarter decisions. This final step is all about closing the loop—taking what you've learned and feeding it directly back into your social media strategy.
This isn’t about just dumping numbers into a spreadsheet. Your job is to tell a story with your data. A good report makes the key takeaways obvious, so anyone from your direct team to the CEO can see exactly what’s working and what isn’t.
Create a Cycle of Constant Improvement
Think of your data as a treasure map. Every metric, every chart, and every insight is a clue showing you where to go next. Following it is what separates the social media accounts that just coast along from the ones that achieve real, measurable growth.
This process boils down to a few repeatable actions:
A/B Test Everything: Stop guessing what your audience wants and start testing. Pit two different headlines against each other. Try a video thumbnail versus a static image. See what happens. If you find that posts with user-generated photos get 30% more shares, that's not an opinion—it's a fact you can build a strategy around.
Fine-Tune Your Timing: Your analytics will tell you exactly when your audience is scrolling. Use this! Scheduling your most important posts for these peak times is one of the easiest wins you can get.
Follow the Money: Is your Instagram campaign bringing in ten times the conversions of your Facebook ads for the same spend? That’s not a subtle hint; it’s a giant flashing sign telling you where to move your budget for a better ROI.
This constant cycle of testing and refining is how you stay ahead. For more ideas on what to test, check out our guide on how to boost social media engagement.
A Real-World Turnaround
Imagine a B2B tech company that only posts generic industry news to LinkedIn. Unsurprisingly, they get almost no engagement and zero leads. Their data tells a story of an audience that just doesn't care.
But digging deeper, they notice something. One post from months ago—a simple behind-the-scenes video of their engineering team—got a surprising number of comments.
Acting on that single insight, they completely change their approach. They ditch the boring news and start sharing content about their company culture, employee stories, and the real process of building their product. Within months, engagement triples, and they generate their first real leads from LinkedIn in over a year.
That’s what this is all about. It’s about understanding what truly motivates your audience.
With around 5.24 billion social media users out there, you have to remember they’re all online for different reasons. According to recent global digital trend reports, a little over half use social media to keep up with friends, while more than a third are there for news. This is exactly why looking beyond simple follower counts is so critical to your success.
Common Questions About Measuring Social Media Success
https://www.youtube.com/embed/Zhh81UPteSs
Even with the perfect strategy laid out, you're bound to hit a few practical snags once you start digging into the data. It happens to everyone. Getting straight answers to these common questions is what builds real confidence in how you're measuring your social media efforts.
Let's clear up some of the most frequent hurdles I see marketers face. The goal is to give you advice you can use right away, so you can stop second-guessing and start moving forward.
How Often Should I Report on My Social Media Performance?
The only real answer here is: it depends entirely on who you're reporting to. There's no one-size-fits-all schedule for social media reports. Different people need different information at different times. If you match the report's timing and detail to your audience, you'll be much more effective.
Here’s a simple framework that I’ve found works well:
- For your internal team: A quick weekly or bi-weekly check-in is usually best. This lets you stay nimble, make small tactical tweaks to your content, and jump on trends before they fade. It’s all about in-the-moment optimization.
- For leadership or clients: Monthly reports tend to be the sweet spot. This gives a solid overview of how you're tracking against the big KPIs without getting lost in the day-to-day noise. You're telling a high-level story and highlighting the key wins.
- For strategic reviews: Quarterly reports are perfect for taking a bird's-eye view. This is your chance to look at long-term trends, evaluate your overall ROI, and make those bigger decisions about budget and strategy for the next quarter.
Whatever cadence you choose, just be consistent. When everyone knows what to expect and when, the whole process runs a lot smoother.
What Is a Good Engagement Rate for Social Media?
Ah, the million-dollar question. Every social media manager wants to know the magic number, but the truth is, there isn't one. A "good" engagement rate is completely relative. It can vary wildly based on your industry, the social platform, and even how many followers you have.
Instead of chasing a universal benchmark that probably doesn't apply to you, focus on improving your own historical performance. Your real goal should be to beat your own numbers, month after month.
If you must compare, look at your direct competitors. That's a far more useful benchmark than a generic industry average because it shows you what's possible within your niche. If your rate is better than your main rival's, you know you're doing something right.
How Do I Measure Social Media ROI Without Direct Sales?
This is a huge one, especially for B2B or service-based businesses where you aren't selling products directly from a post. Just because there's no "buy now" button doesn't mean you can't measure your return on investment. The trick is to assign a dollar value to your non-sales conversions, like leads.
First, figure out what a single lead is worth. Look at your past data. For instance, if you know that 1 in every 20 leads from social media becomes a customer who brings in $10,000, then you can say each lead is worth $500.
Once you have that number, you can track these "lead conversions" using UTM links in your posts and bio. By multiplying the number of leads you generated by their assigned value, you suddenly have a concrete, defendable ROI for your social media efforts.
Ready to stop juggling tabs and start making data-driven decisions? With Publora, you can track all your essential metrics, schedule content, and optimize your strategy from one intuitive dashboard. See how much time you can save and start measuring what truly matters. Start your free 14-day trial today.
