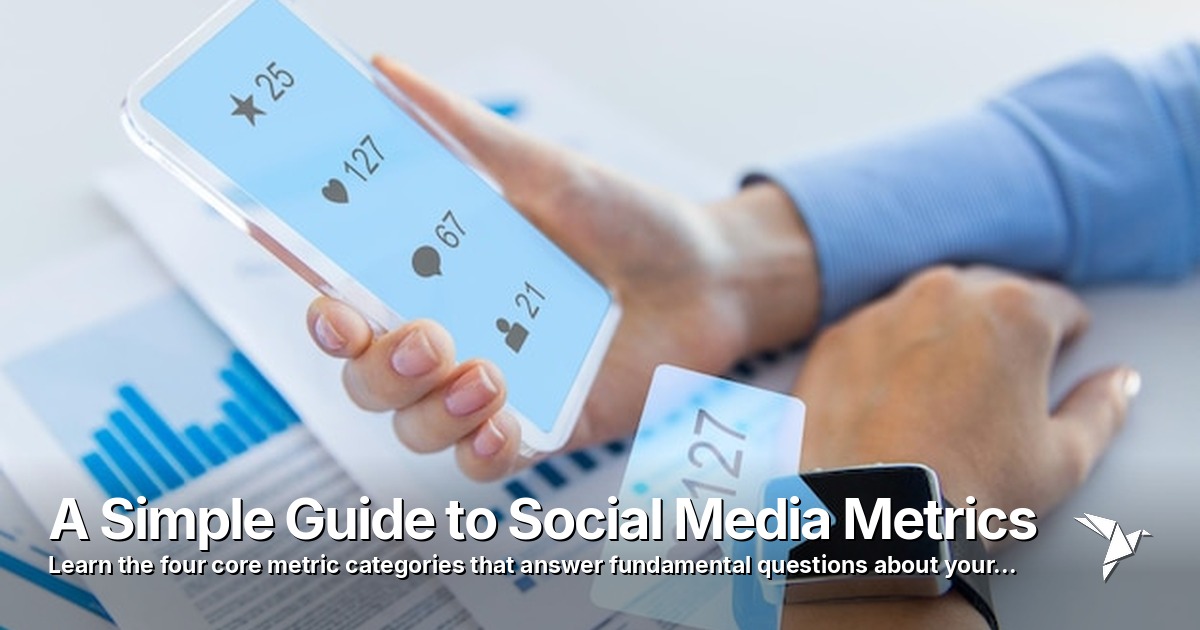
A Simple Guide to Social Media Metrics
TL;DR
Learn the four core metric categories that answer fundamental questions about your social media performance and drive better decisions.
So, what exactly are social media metrics? Think of them as the vital signs for your brand's online presence. They're the specific data points that tell you how your content, campaigns, and overall strategy are performing. In short, they show you what's working, what's falling flat, and why.
The Four Core Metric Categories
Before we dive deep, it's helpful to group these metrics into four main buckets. Each one answers a fundamental question about your performance.
| Metric Category | What It Measures | Key Question It Answers |
|---|---|---|
| Reach & Awareness | How many unique people see your content. | How big is my audience? |
| Engagement | How people are interacting with your content. | Is my audience listening? |
| Conversion | How many people take a desired action. | Is my content driving results? |
| Audience | Who is following and interacting with you. | Am I reaching the right people? |
Understanding these categories helps turn a confusing dashboard into a clear story about your social media efforts.
Why Social Media Metrics Actually Matter
Let's be real—staring at a screen full of charts and numbers can feel like a chore. But flying blind on social media is like trying to drive a car with your eyes closed. These metrics are the feedback you need to turn random posting into a reliable strategy for growth.
Think of it this way: your metrics are the dashboard on your brand's road trip. They show your speed (audience growth), your fuel level (engagement), and even the health of your engine (audience sentiment). Without them, you’re just shouting into the void and hoping for the best.
This is all about getting a closer look at what's really going on behind the scenes.

Successful strategies come from looking past the surface-level numbers and understanding the story the data is trying to tell you.
Moving Beyond Guesswork
Good data brings clarity. When you consistently track your metrics, you can start answering crucial questions with confidence, not just hunches.
- Which content formats does our audience actually enjoy?
- When are our followers most active and likely to see our posts?
- Are we attracting the right kind of followers for our brand?
This data-first mindset lets you create content that truly connects, helping you build a more loyal and engaged community over time. If you want to get specific, understanding key Instagram performance metrics is a great place to start for optimizing your strategy on that platform.
Proving Your Value and ROI
For many of us, justifying the time, effort, and budget poured into social media is a constant battle. This is where your metrics become your best friend. They provide the hard proof you need to show the real business impact of your work.
By connecting metrics like click-through rates and conversions directly to your campaigns, you can draw a straight line from your social media activity to actual revenue. This is how you prove your return on investment (ROI) and make a solid case for more resources.
The opportunity here is massive. As of early 2024, there are over 5.04 billion social media users worldwide, which is a huge chunk of the 5.44 billion global internet users. But to tap into that audience effectively, you have to measure what matters.
Ultimately, tracking the right numbers empowers you to refine your strategy on the fly, prove your worth to stakeholders, and turn your social media channels into a powerful engine for business growth.
Measuring Your Brand's Visibility and Reach
Before you can even think about engagement or sales, you have to ask a simple question: Is anyone actually seeing what I'm posting? This is where visibility and reach metrics come into play. These are the numbers that tell you how big your potential audience is and whether you're successfully getting your brand in front of more people.
Think of it like setting up a stall at a massive market. The metrics in this category tell you how many people are walking down your aisle and how often they glance at your sign. Without knowing this, your other numbers are meaningless. A low engagement rate might feel like a failure, but if you see your reach has doubled, it just means you're talking to a whole new crowd that doesn't know you yet.
Impressions vs. Reach: What’s the Real Difference?
Two of the most basic—and most commonly mixed-up—metrics are impressions and reach. They might sound the same, but they paint very different pictures of who's seeing your content.
Let's use that market stall analogy to break it down:
- Impressions: This is the total number of times people walked past your stall and saw your sign. If one person walks past your stall five times during their shopping trip, that’s five impressions.
- Reach: This is the number of unique people who saw your sign. That shopper who walked by five times? They only count as one person reached.
Impressions tell you how much your content is circulating, like the total foot traffic down your aisle. Reach, on the other hand, gives you a clearer sense of your true audience size—how many individual shoppers actually laid eyes on your stall. You need both, but knowing the difference is crucial for understanding what's really happening.
Are You Actually Growing? Tracking Audience Growth Rate
A static follower count is just a number; it doesn’t tell a story. The real story is in your Audience Growth Rate. This simple percentage shows how quickly you're attracting new followers, giving you a powerful signal about your brand's momentum.
Figuring it out is easy:
- Count how many new followers you gained over a set time (say, a month).
- Divide that by the number of followers you had at the start of the month.
- Multiply by 100 to get your percentage.
So, if you started June with 10,000 followers and ended with 10,500, that’s a 500-follower gain. Your growth rate is (500 / 10,000) x 100 = 5%. Tracking this every month shows you if your content is hitting the mark or if your growth is starting to stall.
Putting Your Reach and Growth Numbers to Work
So you've got the data. What does it mean?
High reach with low engagement can be a red flag. It suggests plenty of people are seeing your content, but it isn't interesting enough to make them stop and interact. The problem could be anything from a weak call-to-action to boring visuals or simply a message that doesn't resonate with the new audience you're reaching.
On the flip side, steady audience growth combined with good engagement is the sweet spot. It means you’re not just pulling in random followers; you’re attracting the right people who actually care about what you have to say. And the potential pool of people is vast—as of early 2025, there are roughly 5.24 billion active social media user identities around the world. For a deeper dive into these numbers, check out the latest global social media usage reports.
At the end of the day, tracking reach and growth isn’t just for show. It’s about building a solid foundation for your marketing, one that consistently introduces your brand to new people who could one day become loyal customers.
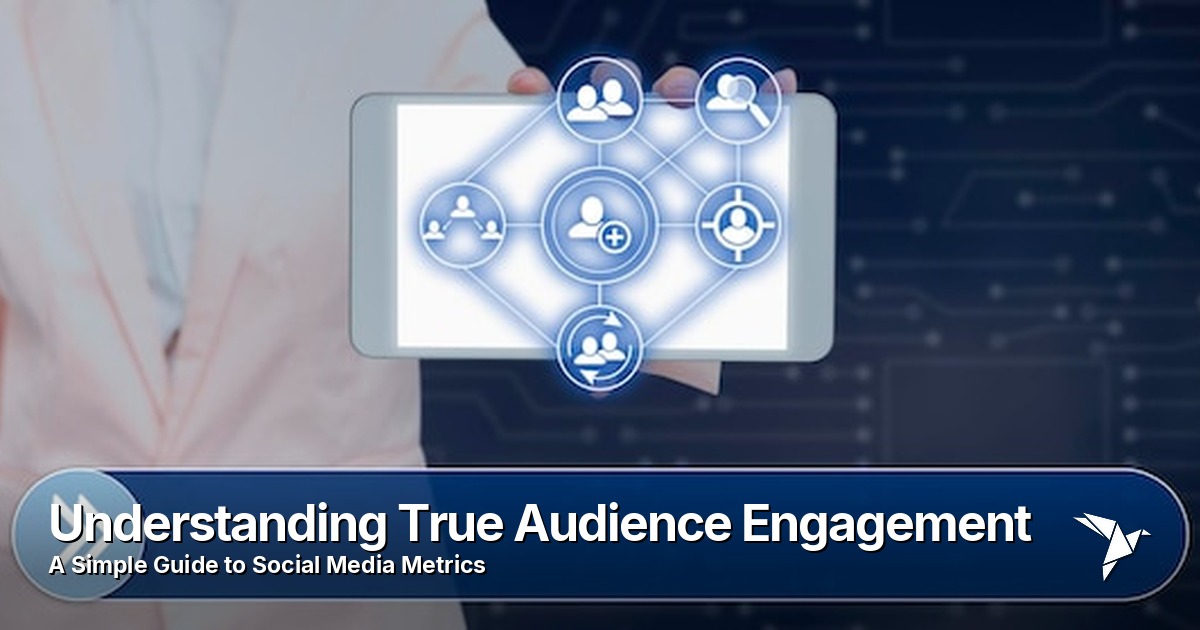
Understanding True Audience Engagement
If reach tells you how many people saw your content, engagement metrics tell you who actually cared. This is the good stuff. Engagement is where passive scrolling stops and genuine connection begins. These are the numbers that show what’s truly hitting home with your audience, moving you way beyond simple vanity metrics.
Think of it this way: Reach is the number of people who walk by your storefront. Engagement is the number of people who stop, walk inside, ask a question, or tell a friend about what they saw. One is about potential, the other is about impact.
Pulling all these metrics into one place, like with a unified analytics dashboard, is a game-changer. You can see at a glance which channels and content types are sparking the most conversation, helping you do more of what works.
The Spectrum of Engagement Actions
It’s important to remember that not all engagement is created equal. I like to think of it as a spectrum, ranging from a simple nod of approval to a full-blown recommendation. Knowing the difference helps you focus on the actions that really drive your goals.
Likes and Reactions: These are your most basic signals. A "like" is a quick and easy way for someone to say, "I see you, and I approve." While they feel good, they are a low-effort form of engagement.
Comments: Now we're talking. A comment takes real effort and opens the door for a conversation. This is direct feedback, and digging into the comments—separating the fire emojis from the genuine questions—gives you incredible insight into what your audience is thinking.
Saves: When someone saves your post, they’re essentially bookmarking it for later. This is a huge win for educational or useful content. It tells you that your post is so valuable, it's being treated as a resource.
Shares: This is the gold standard. A share is the ultimate vote of confidence. Someone is literally putting their own name next to your content and showing it to their network. This not only boosts your reach but does so with a powerful, trusted endorsement.
Why Engagement Rate Is a More Powerful Metric
It’s easy to get excited about a post that gets 1,000 likes, but what if it was seen by a million people? Raw numbers without context can be deceiving. This is why Engagement Rate is one of the most critical metrics you can track. It calculates the percentage of people who interacted, giving you a much clearer picture of how compelling your content really was.
Engagement Rate puts your interactions into perspective. A post that gets 100 likes from an audience of 1,000 is performing much better (10% engagement rate) than a post with 1,000 likes from an audience of 100,000 (1% engagement rate). This percentage helps you compare content performance on an even playing field.
There are a few ways to calculate it, but a solid, reliable formula is Engagement Rate by Reach:
(Total Engagements / Total Reach) x 100 = Engagement Rate %
This formula shows you what percentage of people who actually saw your post were moved to do something. Tracking this helps you measure content quality, not just its visibility.
Analyzing the Quality of Engagement
Beyond just counting the numbers, you need to look at the quality of the engagement. Honestly, a single, detailed comment asking about your service is worth more than 100 mindless likes. This is where you graduate from counting metrics to truly understanding them.
Start asking yourself the right questions:
- Are the comments just emojis, or are people starting real discussions?
- When someone shares your content, what are they saying about it?
- Are people saving your "how-to" guides more often than your salesy posts?
When you do this, your comments section basically becomes a free focus group. The opportunity here is massive; in 2025, users are projected to spend over 14 billion hours per day on social platforms. The teams that actually listen and analyze what's being said are the ones who build strategies with confidence.
By focusing on true engagement, you’re building a community, not just collecting followers. That foundation of genuine connection is what drives real loyalty and, ultimately, business results. To dive deeper into this, check out our complete guide to social media analytics.
Connecting Social Media to Business Results
We’ve talked about how many people see your content (reach) and how many interact with it (engagement). But now we get to the question that really matters to any business: is all this effort actually helping the bottom line?
This is the point where your social media metrics stop being just about social media and start being about real, measurable business growth. These are the numbers that draw a straight line from your creative posts to tangible results like website traffic, leads, and—most importantly—sales. Getting a handle on these metrics is how you prove the financial impact of your work.
From Clicks to Conversions: The Metrics That Show Value
A post going viral is great, but its true worth is measured by what happens next. Does all that attention lead to meaningful action? These are the key metrics that close the loop between social media buzz and business results.
Click-Through Rate (CTR): This is simply the percentage of people who saw your post and were compelled enough to click the link inside it. A high CTR means your content and call-to-action were a perfect match for your audience, successfully moving them from the social platform over to your website.
Conversion Rate: This metric goes one crucial step further. Of all the people who clicked your link, how many actually did what you wanted them to do? That "action" could be anything from signing up for a newsletter, downloading an ebook, or making a purchase. It’s the ultimate test of whether your campaign truly worked.
Tracking these does take a little setup, but it’s absolutely worth it. The best way is to use UTM parameters, which are small snippets of code you add to your URLs. This lets your website analytics know exactly which social media post sent you traffic and, eventually, a new customer.
A Practical Example: Tracking an E-commerce Campaign
Let's walk through a real-world scenario. Imagine you run a small e-commerce brand selling handmade ceramics and you want to launch a new collection on Instagram.
Here’s how you’d follow the customer’s journey from a simple post to a final sale:
The Post: You share a gorgeous photo of a new mug on Instagram, with a link in your bio pointing to the product page. You tag this link with a UTM parameter (like
?utm_source=instagram&utm_campaign=summer_mugs).The Click: A follower sees the post, falls in love with the mug, and clicks the link. Right away, your website analytics logs a new visitor from your "summer_mugs" Instagram campaign. This click adds to your CTR.
The Sale: The user lands on your product page and decides to buy the mug. Because of that UTM tag, your analytics can attribute this sale directly back to your Instagram campaign. That’s a conversion.
When the campaign is over, you can see precisely how many clicks and sales your Instagram efforts generated. This data isn't just for reporting—it helps you make smarter decisions next time. For a deeper dive, understanding the core social media key performance indicators provides a solid framework for all your measurement efforts.
Calculating Your Social Media Return on Investment (ROI)
At the end of the day, your boss, clients, or stakeholders want to know one thing: is the time and money we’re putting into social media paying off? Calculating your Social Media ROI gives you a clear, financial answer to that question.
You don't need a complicated formula to get started.
To find your basic ROI, just take the profit from your social media activities, subtract your total investment (ad spend, tools, staff time), divide that number by the investment, and multiply by 100 to get a percentage.
ROI = [(Profit - Investment) / Investment] x 100
Let’s go back to our ceramics brand. If the campaign brought in $1,000 in profit and the total cost was $250, the ROI would be an impressive 300%.
That’s a powerful number to bring to your next budget meeting. It’s how you shift the conversation about social media from being a "nice-to-have" expense to a proven profit center for the business.
Listening To What People Say About Your Brand

It’s easy to get lost in the numbers—the likes, shares, and sales. But some of the most valuable insights on social media aren’t about what people do, but what they say and how they feel about your brand. These sentiment metrics give you a direct line to your reputation and the health of your customer relationships.
Think of it as the digital equivalent of a town hall meeting. You can hear the good, the bad, and the ugly. It’s your chance to catch customer service hiccups before they blow up, find out what people truly love about you, and see exactly where you stand against the competition. This isn’t just about listening; it’s about gathering intelligence to build a brand people respect and trust.
How Well Are You Serving Your Customers?
On social media, speed and attention matter. A lot. When a customer reaches out with a question or a problem, silence is one of the worst possible responses. How you handle these interactions says everything about how much you value your community, which is why you absolutely have to track your customer service performance.
There are two core numbers to keep a close eye on here:
- Customer Response Rate: Simply put, what percentage of customer comments and questions does your team actually reply to? A high number shows you're engaged and that no customer is being ignored.
- Customer Response Time: How quickly, on average, do you get back to people? In a world of instant gratification, a fast reply shows your customers you're there for them and ready to help.
These aren't just vanity metrics for a report. They are a direct reflection of the experience you’re delivering. Improving them is one of the quickest ways to build loyalty and prove you're a brand that cares.
Understanding Your Share of the Conversation
When people talk about your industry online, how often is your brand's name mentioned? That’s what your Social Share of Voice (SOV) reveals. It’s a key competitive metric that measures your brand's visibility against your rivals.
Social Share of Voice is the slice of the pie that belongs to you. It calculates what percentage of the total conversation about your industry—including mentions of your competitors—is actually about your brand.
If your SOV is growing, it’s a great sign that your marketing and brand awareness efforts are working. You're not just shouting into the void; you're becoming a bigger, more recognized player in your space. Tracking this manually is a huge task, but a unified tool like Publora can automate it, giving you a clear picture of your market presence.
What’s the Vibe? Gauging Audience Sentiment
Knowing that people are talking about you is one thing. Knowing how they feel is another entirely. This is where Social Sentiment analysis comes into play. By looking at the actual language people use when they mention your brand, you can sort those conversations into three simple categories: positive, negative, or neutral.
This gives you an immediate pulse check on your brand's health. You can use it to:
- Spot problems early: A sudden spike in negative comments could be the first sign of a faulty product or a problem with your shipping process.
- Find your biggest fans: People sharing positive experiences are your best brand advocates. Their words are powerful testimonials you can feature as social proof.
- Check a campaign's pulse: Did that new ad resonate with people, or did it miss the mark? Sentiment will tell you, often in real time.
When you start tracking these brand health metrics, your social media accounts become more than just a place to post updates. They transform into a powerful source of business intelligence that helps you protect your reputation, delight your customers, and build a stronger brand.
How to Simplify Your Metrics with Unified Tools
Let's be honest. Juggling analytics across multiple social platforms is a recipe for chaos. One minute you're exporting a clunky spreadsheet from Instagram, and the next you're trying to make sense of LinkedIn's completely different dashboard. Constantly switching between platforms is inefficient, confusing, and makes seeing the big picture feel almost impossible.
Think of it like trying to cook a complex meal by running between three separate kitchens. You’d lose track of what’s simmering, what's burning, and how all the different parts are supposed to come together. That’s exactly what happens when your social media metrics are scattered all over the place.
This is where unified analytics tools step in. They act as your central command center, pulling all your critical data into one clean, organized dashboard.
The Power of a Single Dashboard
Instead of battling endless browser tabs and mismatched reports, a unified tool gives you a single source of truth. Platforms like Publora connect to all your social accounts, pulling the data into one spot so you can actually compare performance side-by-side.
This holistic view is a game-changer. Suddenly, you can see what’s working on TikTok versus what’s driving clicks on Facebook at a glance. That clarity takes the guesswork out of the equation and helps you make smarter, faster decisions about your content strategy.
A unified analytics tool isn’t a luxury; it’s a must-have for any marketer who wants to move from just collecting data to actually using it. It saves you from the headache of manual reporting and gives you back the time to focus on what really matters—creating great content.
Making Sense of the Noise
Once you have all your social media metrics in one place, you can finally start to understand your performance and plan your next move with confidence. To get a complete picture, it helps to start with a structured review. Many experts recommend exploring the six key areas of a social media audit to build a solid foundation for your analysis.
This methodical approach, combined with the right platform, turns overwhelming data into clear, actionable insights. You can start asking—and answering—the big questions:
- Which platform is driving the most website traffic?
- Is our engagement rate higher with video or image posts?
- How does our audience growth on LinkedIn stack up against our growth on Instagram?
By bringing all your analytics together, you transform a scattered mess of numbers into a clear story about your brand's performance. If you're new to these kinds of platforms, our guide on social media management tools is a great place to start.
Got Questions About Social Media Metrics? We’ve Got Answers.
Alright, so you’ve got the basics down. But when it comes to actually using social media metrics day-to-day, things can get a little fuzzy. Let's clear up some of the most common questions that pop up once you start digging into the data.
How Often Should I Actually Check My Metrics?
This is a classic question. You want to stay on top of things, but you don't want to get lost in a sea of numbers. Finding the right rhythm is key. Here’s a schedule that works for most businesses:
- Weekly Check-in: Take a quick peek at your core engagement and reach stats. This helps you spot any big wins or sudden drops. It’s perfect for making small tweaks, like pushing more of a certain type of content that’s clearly hitting the mark.
- Monthly Review: This is when you zoom out a bit. Dig into your progress toward bigger goals, like audience growth and your overall engagement rate. Look for broader patterns and pull together your performance reports here.
- Quarterly Strategy Session: Time for the big picture. This is where you evaluate your ROI, share of voice, and other high-level metrics. Use this deep dive to make major strategic decisions for the upcoming quarter.
So, What’s a Good Engagement Rate?
Ah, the million-dollar question. The honest-to-goodness answer? It depends. A "good" rate is all relative. It changes wildly based on your industry, the platform you're on, and even how many followers you have. For instance, an account with 1,000 super-engaged fans might hit a 10% engagement rate, while a massive brand with a million followers would be thrilled with 1-2%.
Forget chasing a universal "good" number. The only benchmark that truly matters is your own. Your goal should be to steadily improve your engagement rate over time. That’s the real sign you’re heading in the right direction.
Should I Ignore Vanity Metrics Altogether?
It’s easy to dismiss things like follower counts and likes as "vanity metrics." After all, they look impressive but don't always tie directly to sales. But hold on—they aren't completely useless.
Think of them as signals. A growing follower count shows your brand awareness is on the rise. A post that gets a ton of likes obviously struck a chord with people. The trick is to see them as just one piece of a much larger puzzle. Acknowledge them, but always tie them back to the metrics that really move the needle, like engagement rate, clicks, and conversions, to understand what's actually working.
Ready to stop juggling spreadsheets and start making smarter decisions? Publora brings all your social media metrics into one clear, actionable dashboard. Try Publora free for 14 days and see your data in a whole new light.
Related Articles

How to Measure Social Media Success
Go beyond vanity metrics. Learn to track data that directly ties to your business goals, from brand awareness to lead generation.
Mastering Social Media Return on Investment
Social media ROI is the harvest from your marketing efforts. Learn to measure real business value from your channels.
Mastering Content Performance Metrics
Think of metrics as a report card for every piece of content. Learn what hits, what misses, and why it matters.
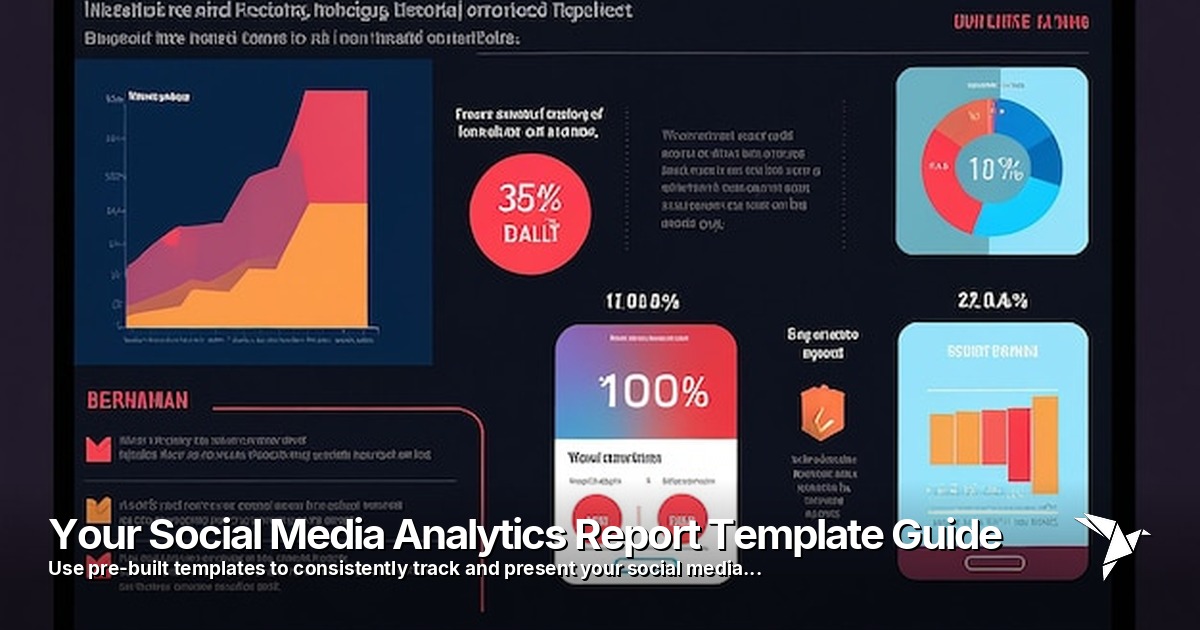
Your Social Media Analytics Report Template Guide
Use pre-built templates to consistently track and present your social media performance, turning data into actionable insights.