Master Social Media Analytics and Grow Your Brand
TL;DR
Turn social media data into actionable insights. Learn how analytics reveals what your audience truly cares about.
Trying to grow on social media without looking at your data is a lot like driving with a blindfold on. You're moving, sure, but you have no real idea where you're going. That's where social media analytics comes in. It’s the simple practice of gathering and looking at the data from your social channels to figure out what's actually working. It turns a jumble of numbers into a clear story about what your audience truly cares about.
What Is Social Media Analytics and Why It Matters
Don't think of social media analytics as a chore involving spreadsheets. Think of it as your brand's personal playbook. It tells you which content hits home, what falls completely flat, and what finally convinces a follower to click, buy, or sign up. Without it, you’re just throwing content at the wall and hoping something sticks. With it, you're making smart moves backed by real evidence.
This data-first mindset lets you see past vanity metrics like how many followers you have. Instead, you start to understand the real story behind your online presence. For a deeper dive into the whole field, this guide on social media marketing analytics is a great resource.
Understanding the Story Behind the Numbers
At its heart, social media analytics helps you answer the big questions about your strategy. It’s not about counting likes; it's about figuring out why people are liking your content in the first place. This helps you:
- Find Your Winning Content: Pinpoint exactly which posts, formats (like video vs. images), and topics get people talking.
- Perfect Your Timing: Figure out the best times to post for your audience, not just what some generic study says.
- Know Your Audience Better: Get a clear picture of who your followers are, what they’re interested in, and how they behave online.
- Measure Real Business Impact: Finally connect the dots between your social media activity and actual business goals like website visits, leads, and sales.
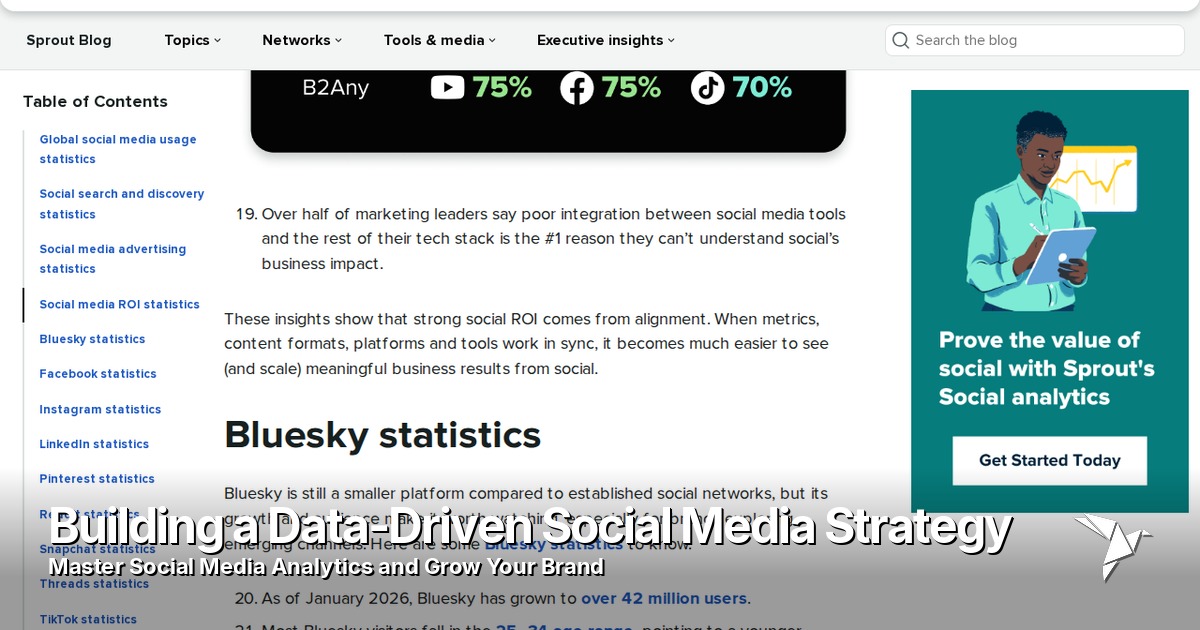
Given how massive social media is, this is more critical than ever. By 2025, an estimated 5.45 billion users will be on social media, making analytics essential for making sense of it all. People spend an average of 2 hours and 24 minutes a day on these platforms, and their reasons for being there are all over the map—from keeping up with family (48.7%) to getting inspiration for a new purchase (26.6%). Analytics helps you cut through that noise.
When you look at your analytics, you aren't just looking backward. You're gathering the clues you need to predict what will work next, helping you build a much stronger brand.
Ultimately, getting serious about social media analytics means you stop reacting and start planning. Instead of just posting and hoping for the best, you use data to build a reliable engine for growth. It empowers you to stop guessing, spend your budget wisely, and get real results.
The Social Media Metrics That Actually Drive Growth
Jumping into your social media analytics can feel overwhelming. You're flooded with numbers, charts, and graphs. It’s tempting to latch onto the easy ones—the vanity metrics. Follower counts and post likes look great on a report, but they rarely tell you anything meaningful about your business.
Real success comes from filtering out that noise and focusing on the numbers that connect directly to your goals. Let's break down the most important metrics into four key areas. Think of them as the four legs of a table—each one is essential for building a stable, successful social media strategy.
1. Awareness: How Far Is Your Message Reaching?
This first area answers a simple question: "How many people are actually seeing our stuff?" These are your top-of-funnel numbers, giving you a sense of your potential audience size and how well your content is spreading.
There are two core metrics to watch here:
- Reach: This is the total count of unique individuals who saw your post. If you hosted a concert, reach would be the number of people in the audience.
- Impressions: This is the total number of times your content was shown. One person might see your post in their feed three separate times. That counts as one person reached but three impressions.
So, what's the difference? A ton of impressions with very low reach might mean you're showing the same ad to the same small group over and over. That's not always bad, but it tells a much different story than high reach, which proves your content is finding new audiences.
The image below shows how tracking the right data leads to better audience insights and, ultimately, a stronger return on your investment.
As you can see, a strategic approach to analytics is what separates guessing from growing.
2. Engagement: Are People Actually Paying Attention?
Okay, so people are seeing your content. The next logical question is, "Do they care?" Engagement metrics tell you how people are interacting with what you post, which is a fantastic indicator of how well your message is landing. A highly engaged audience is a healthy one.
Here’s what to look for:
- Engagement Rate: This is the percentage of your audience that saw a post and then liked, commented, shared, or saved it. It’s one of the best ways to measure the raw quality of your content.
- Shares and Saves: These are pure gold. A share means someone thought your content was so good they put their own name on it and showed it to their friends. A save means they want to come back to it later. Both are signs of truly valuable content.
Think about it this way: a post with 10,000 likes but only 10 shares is far less impactful than one with 1,000 likes and 200 shares. The second one created hundreds of brand advocates.
3. Conversion: Is Your Social Media Making You Money?
This is where the rubber meets the road. Conversion metrics answer the big question: "Is all this work actually leading to business results?" These are the actions that directly impact your bottom line, turning followers into customers.
The most important conversion metrics include:
- Click-Through Rate (CTR): What percentage of people who saw your post actually clicked the link? A high CTR means your call-to-action was irresistible.
- Cost-Per-Click (CPC): If you're running ads, this tells you how much each click is costing you. The goal is to get this number as low as possible without sacrificing quality.
- Conversion Rate: Of the people who clicked your link, how many completed the desired action—like buying a product or signing up for your email list? This is the ultimate measure of ROI.
To get a full picture of your marketing's effectiveness, it's helpful to look at all your content performance metrics together, not just social media in isolation.
4. Audience: Who Are You Talking To?
Finally, this last group of metrics helps you answer, "Who is our audience, and what makes them tick?" This is about understanding the people behind the profiles, which is crucial for refining your strategy over the long haul.
Key audience insights to track are:
- Audience Demographics: Information like age, gender, location, and language helps you verify that you're reaching your ideal customer.
- Sentiment Analysis: This is about tracking the feeling behind the comments and mentions—are they positive, negative, or neutral? It’s a great way to gauge brand health.
- Audience Growth Rate: How fast are you attracting new followers? A steady, positive growth rate shows your brand has momentum and appeal.
Organizing your analytics around these four areas gives you a clear, actionable framework. To take the next step, you can learn how to turn these metrics into specific targets by reading our guide on setting the right social media KPIs. This ensures every number you track is pushing your brand in the right direction.
Choosing the Right Social Media Analytics Tools
Picking the right social media analytics tool feels a lot like choosing between a pocketknife and a full-on Swiss Army knife. Both are useful, sure, but they’re built for entirely different jobs. Making the right choice is what turns a flood of confusing data into a clear stream of insights you can actually use to steer your strategy.
Your options really boil down to two main camps: native analytics and third-party platforms. Each has its place, and knowing the difference is the key to building a workflow that fits your goals and your budget.
Native Analytics: Your Starting Point
Every social network worth its salt—from Instagram and TikTok to Facebook—gives you its own built-in analytics. These tools, like Instagram Insights or Facebook Page Insights, offer a free, direct look at your performance on that specific platform.
Think of native analytics as the dashboard in your car. It gives you the essentials at a glance: your speed (reach), your engine temp (engagement), and how much gas is in the tank (audience growth). If you’re a solo creator or a small business just getting your feet wet, this is often all you need to get a handle on things.
These tools are perfect for answering straightforward questions like:
- Which of my Reels got the most views this week?
- What time of day are my followers most active on Facebook?
- What’s the age and gender breakdown of my TikTok audience?
The big catch, however, is that they all live in their own little worlds. If you’re juggling five different social profiles, you’re logging into five different places to pull five different reports. It gets old fast and makes it nearly impossible to see the bigger picture.
Third-Party Platforms: The Command Center
Once your social media presence starts to grow, you’ll need to graduate from a collection of dashboards to a central command center. This is exactly where third-party social media analytics tools come into play. Platforms like Publora are built to plug into all your social accounts, pulling all that data into one unified, easy-to-read view.
This isn't just about saving time, though. It unlocks a much deeper level of analysis that native tools simply can’t touch.
A centralized platform turns isolated data points into a cohesive story. It’s the difference between reading a single chapter and finally understanding the entire book of your brand's digital performance.
For instance, you can directly compare how one campaign did on Instagram versus LinkedIn. You can track brand sentiment across every channel, automate weekly reports for stakeholders, and see how your growth stacks up against your competitors—all from one spot. That holistic view is what allows you to make truly smart, strategic decisions. For a closer look at what's out there, this list of the best Instagram analytics tools gives a great sense of what specialized platforms can do.
When to Upgrade to a Comprehensive Tool
So, how do you know it’s time to move on from native analytics? It's a pretty clear sign you've outgrown them if you're starting to ask bigger, more complex questions:
- You manage multiple platforms: You're spending way too many hours manually stitching together reports from different networks.
- You need competitive insights: You want to know how your share of voice compares to your top three rivals.
- You need to prove ROI: You have to connect your social media efforts to real business goals, like leads or sales, and present it clearly to your boss or clients.
- You need deeper analysis: You want to understand the overall feeling or sentiment around your brand, not just the "likes" on a single post.
If any of this sounds familiar, investing in a unified platform is the natural next step. When you centralize your data, you free up precious time to focus on what actually matters: turning those numbers into a strategy that drives real growth. To help you navigate the choices, we put together a detailed guide on the top social media analytics tools that can make this whole process a lot simpler.
Turning Social Data into Actionable Insights
Collecting social media data is a lot like stocking your pantry with fresh ingredients. You've got everything you need, but the real magic only happens when you actually start cooking. The true value comes from interpretation—learning to read the story your numbers are telling and turning raw metrics into a recipe for success.
This is where you graduate from simply knowing what happened to understanding why it happened. And answering that "why" is the critical bridge between gathering data and making smarter decisions that genuinely improve your social media game.
From Metrics to Meaning
Every metric you track tells a piece of the story, but they're most powerful when you look at them together. A single number by itself can be completely misleading. For instance, what if your latest video got extremely high reach but almost no engagement?
At first glance, high reach sounds amazing. But when you pair it with low engagement, it starts to look more like a problem. It could mean your content landed in a ton of feeds, but the thumbnail, title, or first few seconds just didn't grab anyone's attention.
The story here isn't one of broad appeal; it’s one of a missed opportunity. Your job is to figure out what made people scroll right past instead of stopping to watch, comment, or share.
Social media analytics isn't about finding numbers that make you look good. It's about finding the truth in your data, even if it's uncomfortable, so you can build a strategy that genuinely connects with your audience.
This process is all about spotting the spikes and dips in your performance and asking tough questions. Did a post suddenly take off? Don’t just celebrate it—investigate it. Was it the format (like a carousel versus a single image), the topic, the time you posted, or a new hashtag you tried? Replicating your wins starts with understanding what caused them in the first place.
Answering “Why” With Sentiment and Trends
To get deeper insights, you have to look beyond the basic numbers and dig into the qualitative side of your data. Sentiment analysis, for example, is a fantastic way to understand the feeling behind the comments and mentions your brand receives. Are people excited, frustrated, or just plain indifferent?
Imagine you’re a coffee brand that just launched a new pumpkin spice latte. Your announcement post gets thousands of comments—great engagement, right? But sentiment analysis reveals that 70% of those comments are negative, with people complaining that the new recipe is way too sweet.
That insight is instantly actionable. You now know to:
- Address the feedback publicly: Show customers you’re listening by acknowledging their opinions.
- Inform your product team: This is real-world feedback that can help guide future recipe tweaks.
- Refine future marketing: Your next campaign can highlight a "new, less-sweet formula" based on what customers told you directly.
This proactive approach is becoming more important than ever. Social media analytics is increasingly powered by AI-driven tools. Marketers are leaning on social listening and AI-generated content to improve their ROI and engagement. For example, 90% of businesses using generative AI report saving a significant amount of time, while 73% see real bumps in their engagement rates. Analytics tools that have AI baked in can give you actionable data on user sentiment and what’s trending, helping you tailor your message with incredible precision.
Creating Your Action Plan
Once you've uncovered these insights, the final step is to turn them into a concrete plan. Don't let your findings die in a report. Translate them into specific tasks and strategic changes. This is the heart of measuring social media success effectively.
Here’s a simple way to turn an insight into action:
- Insight: "Our tutorial videos on Instagram Reels get twice as many saves as our behind-the-scenes posts."
- Action: "For the next month, we will shift our video strategy to produce three tutorial videos for every one behind-the-scenes post."
- Hypothesis: "This change should increase our overall save rate by 30% and help us grow a more engaged audience."
By creating a clear action plan, you build a cycle of continuous improvement. You use data to make a change, measure the results of that change, and then refine your strategy all over again. This transforms social media analytics from a chore into an active engine for growth that will boost your content, engage your audience, and maximize your ROI.
Building a Data-Driven Social Media Strategy
Let's be honest: great social media analytics isn't about pulling a report five minutes before a big meeting. It’s about building a habit of using data every single day to make smarter decisions. When you do that, analytics stops being a chore and starts becoming your secret weapon for building a social presence that actually works.
Think of it like this: a one-off report is like getting a single snapshot of your health. It’s useful, but it doesn't tell the whole story. Consistent, ongoing analysis is like having a real-time health monitor, giving you the feedback you need to adapt and improve on the fly. You're creating a feedback loop where every post teaches you something for the next one.
Set Goals That Guide Your Actions
Before you get lost in a sea of metrics, you need to ask one simple question: "What are we actually trying to do here?" Your social media goals can't exist in a vacuum; they have to directly support your bigger business objectives. Otherwise, you’re just chasing vanity metrics.
The key is to connect your business goals to clear, measurable Key Performance Indicators (KPIs).
- Want more brand awareness? Then you should be obsessing over metrics like reach, impressions, and how quickly your audience is growing.
- Need to generate leads? Your focus should be squarely on click-through rates (CTR), conversions, and leads generated directly from your social channels.
- Trying to build a community? The numbers that matter are your engagement rate, the number of comments per post, and how often people are mentioning your brand.
This is where SMART goals (Specific, Measurable, Achievable, Relevant, Time-bound) come in handy. Don't just say, "We need more followers." A much better goal is, "We will increase our Instagram follower count by 10% this quarter by posting three high-engagement Reels each week." See the difference? One is a wish, the other is a plan.
Establish a Practical Reporting Cadence
Once your goals are set, you need a rhythm for checking in on your progress. A consistent reporting schedule keeps everyone on track and helps you spot trends—good or bad—before they become big problems or missed opportunities. There's no one-size-fits-all answer here; it all depends on your team and your goals.
A good starting point might look like this:
- Daily Quick Checks: A five-minute scan in the morning to catch any major performance spikes or dips.
- Weekly Reviews: A deeper dive into what worked and what flopped last week. Use these insights to plan your content for the week ahead.
- Monthly Strategic Reports: A comprehensive look at your progress toward those big KPIs, perfect for sharing with stakeholders to show the value of your work.
Use Data to Test and Optimize
Your analytics dashboard is a treasure trove of ideas just waiting to be tested. Use the data you gather to form hypotheses and then run small experiments. Stop wondering if posting at 9 AM is better than 5 PM—test it for a couple of weeks and let the data give you the answer.
A data-driven strategy means you stop asking, "What should we post?" and start asking, "What does our data suggest we should post next?" This simple shift moves you from guesswork to calculated execution.
This constant cycle of testing, measuring, and refining is what separates the best social media strategies from the rest. With global social media ad spending projected to hit $276.7 billion in 2025, the stakes are higher than ever. As platforms change and the competition gets fiercer, using analytics to make every post and every dollar count isn't just a good idea—it's essential for growth. You can discover more about these key social media trends to stay ahead of the curve.
Putting Your Analytics into Action with Publora
Understanding your social media data is great, but actually acting on it is a whole different ballgame. This is where most teams get stuck. You find yourself spending more time jumping between platforms and piecing together reports than you do using those insights to build a better strategy.
Juggling native analytics tools from Instagram, TikTok, and LinkedIn isn't just a time sink—it creates isolated pockets of data. When your numbers are scattered, you can't see the full story of what's working and what isn't.
That’s exactly the problem Publora was built to solve. Think of it as your mission control for social media analytics. Instead of logging into five different apps to pull numbers, Publora gathers all your key metrics into one clean, simple dashboard. This gives you an instant, side-by-side view of how your campaigns are performing across every single channel.
From Cluttered Data to Clear Decisions
The real magic of a tool like this is how it turns a jumble of disconnected numbers into a clear, cohesive story. Publora doesn’t just throw data at you; it organizes it into easy-to-read charts and graphs. This helps you spot trends, see which content is resonating, and pinpoint opportunities for improvement in a single glance.
Forget wrestling with messy spreadsheets or trying to compare apples to oranges.
The dashboard below gives you a taste of how Publora organizes cross-platform engagement, reach, and audience growth all in one place.
This kind of visual summary makes it obvious which network is bringing in the most engagement or where your audience is growing fastest. It helps you make smarter, quicker decisions about where to invest your time and energy.
Automate Reporting and Gain a Competitive Edge
Beyond just bringing your data together, Publora automates one of the most draining parts of the job: reporting. You can schedule automated weekly or monthly reports to be sent straight to your team or key stakeholders. This frees up hours of your time and delivers professional-looking updates that focus on the KPIs that matter to your goals.
But it also gives you a few features that provide a real strategic advantage.
- Competitive Benchmarking: See exactly how you measure up against your main competitors. You can track their follower growth, engagement rates, and content strategy to spot weaknesses in their approach and opportunities for you.
- Advanced Sentiment Analysis: Go deeper than just likes and comments. This feature helps you understand the feeling behind the conversations surrounding your brand. You can instantly see if the chatter is positive, negative, or neutral, which allows you to get ahead of any reputation issues.
By bringing all your social media analytics under one roof, Publora transforms data from a reactive reporting tool into a proactive engine for growth.
When everything from cross-channel performance to competitive insights is in one spot, you can finally stop chasing down data. Instead, you can start using it to build a smarter strategy, prove the value of your work, and drive results that actually matter.
Got Questions About Social Media Analytics? We’ve Got Answers.
Jumping into social media analytics always sparks a few questions. That's a good thing! Getting clear answers is the first step to turning all that data from overwhelming numbers into a real-world tool for growth.
Let's walk through some of the most common questions people ask when they're just getting started.
"So, How Often Should I Actually Check My Analytics?"
This is probably the number one question I hear. Everyone wants a magic number, but the honest answer is: it depends entirely on your goals. The trick is to find a rhythm that keeps you informed without making you feel chained to your dashboard.
A balanced approach usually works best.
- Daily Peek (5 Minutes): A quick scan each morning is perfect for catching anything that needs immediate attention. Did a post unexpectedly go viral overnight? Are there customer service issues blowing up in the comments? This keeps you agile.
- Weekly Review (30-60 Minutes): I like to block off time on Monday mornings for this. Look back at the past week to see what worked and what didn't. This is where you'll spot small trends and get ideas to tweak your content plan for the week ahead.
- Monthly Deep Dive (1-2 Hours): This is your big-picture strategy session. At the end of each month, you'll want to pull a full report to see how you're tracking against your main business goals (your KPIs). This is where you make major strategic decisions for the next month's campaigns.
"What's the Real Difference Between Analytics and Social Listening?"
It's easy to get these two mixed up since they both involve data, but they serve two totally different purposes. Getting them straight is crucial, because you need both to get the full story.
Social media analytics is like looking in the mirror. It's focused inward on your channels and your performance. You're tracking things like your engagement rate, follower growth, and how many people clicked the links in your posts. It’s all about what you did and how it landed.
On the other hand, social listening is like looking out the window. It's about tuning into conversations happening all across the internet—not just on your page. You're tracking mentions of your brand, your competitors, and important industry keywords to gauge public sentiment and spot trends before they become obvious.
"How Can I Actually Prove the ROI of My Social Media Efforts?"
Ah, the million-dollar question. Justifying your budget and proving your work has a real impact on the bottom line is what it's all about. The key is to draw a straight line from your social media activity to tangible business results.
This means you have to get serious about tracking conversions. Use tools like UTM codes in every link you share. This lets you see exactly how many website visits, lead sign-ups, or even direct sales came from a specific social media post.
Once you can track those actions, you can assign a dollar value to each one. From there, it's simple math: you can calculate exactly how much revenue your social media is generating and compare it to what you're spending.
Ready to stop guessing and start making confident, data-backed decisions? Publora brings all your social media analytics into a single, clear dashboard. Start your free 14-day trial today and see the full story your data is telling you.
Related Articles
How to Measure Social Media Success
Go beyond vanity metrics. Learn to track data that directly ties to your business goals, from brand awareness to lead generation.
Mastering Social Media Return on Investment
Social media ROI is the harvest from your marketing efforts. Learn to measure real business value from your channels.
Mastering Content Performance Metrics
Think of metrics as a report card for every piece of content. Learn what hits, what misses, and why it matters.
Your Social Media Analytics Report Template Guide
Use pre-built templates to consistently track and present your social media performance, turning data into actionable insights.