Your Social Media Analytics Report Template Guide
TL;DR
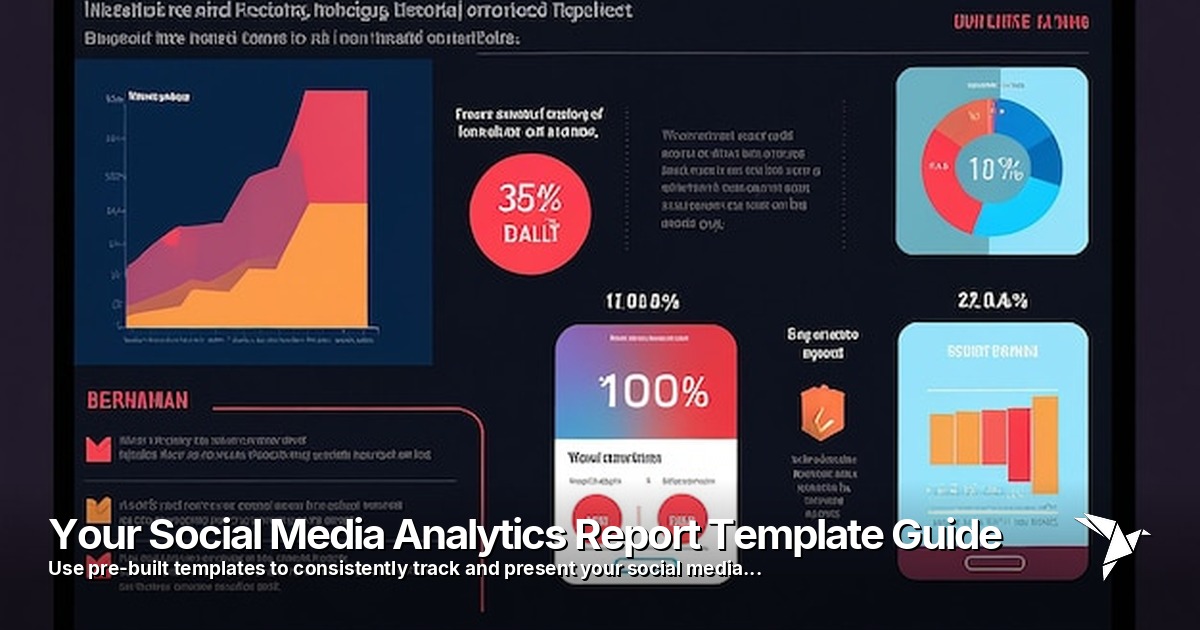
Use pre-built templates to consistently track and present your social media performance, turning data into actionable insights.
Think of a social media analytics report template as your secret weapon. It’s a pre-built document that gives you a consistent way to track, analyze, and present your social media performance. Instead of starting from scratch every single time, you have a reliable blueprint that turns mountains of data into clear, actionable insights.
Why Your Report Template Is a Strategic Advantage
Let's be honest, nobody loves pulling reports. But what if your report wasn't just a chore, but a powerful tool for proving your team's value? A well-crafted social media analytics report template does exactly that. It helps you tell a compelling story with your data, one that justifies marketing spend and shapes smart decisions for the future.
When you have a standardized template, the monthly scramble to pull numbers disappears. In its place, you have a professional, repeatable process. This consistency is huge—it builds trust with everyone from your direct manager to the C-suite because you're all speaking the same language and looking at success through the same lens.
From Data Dumps to Actionable Insights
The real point of a report isn’t just to display numbers; it's to explain what those numbers actually mean for the business. A good template forces you to move past simple data-dumping and connect the metrics to real-world business outcomes.
For instance, seeing a sudden spike in Instagram reach is interesting, but it's just a number on its own. A solid template will have a section for analysis, prompting you to dig into why it happened. Was it that new Reel format you tried? A trending audio clip? Once you identify the cause, you've found a tactic you can repeat. That’s the difference between passive reporting and active strategy.
The demand for this kind of insight is exploding. The global social media analytics market was valued at USD 14 billion and is expected to climb to USD 83.11 billion by 2033. As you can read in this IMARC Group report, this massive growth highlights just how much businesses are relying on data to sharpen their strategies. Your report is no longer a "nice-to-have"—it's a critical tool for survival and growth.
A great template doesn't just present data; it asks the right questions. It guides you, the storyteller, to connect the dots between your actions and the results, making sure every report delivers value that goes way beyond the metrics themselves.
Here's a quick overview of the core sections every effective social media analytics report must have to deliver a complete performance narrative.
Essential Components for Your Report Template
| Component | Purpose | Example Metrics |
|---|---|---|
| Executive Summary | A high-level overview of performance, key wins, and top recommendations for busy stakeholders. | Overall Follower Growth, Total Engagement, Key Campaign Highlights. |
| Platform-Specific Breakdown | Detailed analysis for each social channel, showing what's working (and what's not) on each one. | Instagram Reach, Facebook Clicks, LinkedIn Engagement Rate. |
| Audience Growth & Demographics | Tracks follower changes and provides insight into who your audience is. | New Followers, Follower Demographics (Age, Location), Unfollows. |
| Content Performance | Identifies top-performing posts to inform future content strategy. | Top Posts by Engagement, Video View-Through Rate, Clicks per Post. |
| Campaign-Specific Analysis | Measures the success of targeted campaigns against their specific goals. | Campaign Reach, Conversion Rate, Cost Per Result. |
| Key Learnings & Next Steps | Translates the data into actionable insights and outlines the plan for the next reporting period. | "What we learned," "What we'll do next." |
Putting these pieces together ensures you're not just reporting numbers, but telling a full story about your social media efforts and their impact.
The Power of a Unified View
Ultimately, a strong template creates a single source of truth. It puts an end to the confusion that comes from looking at different spreadsheets and ad-hoc reports.
When stakeholders get the same, easy-to-read format every month or quarter, they know exactly where to find the information they care about. This cuts down on the back-and-forth and frees you from answering the same questions over and over. You get to spend less time building reports and more time on what really matters: using that data to grow the brand.
Connecting Business Goals to Social Media Metrics
Let's be honest: a report filled with numbers but no context is just noise. Before you even think about building a social media analytics report template, you have to tie every single metric you plan to track back to a real business outcome. If you skip this step, you're not reporting on progress; you're just presenting data for data's sake.
So, start with the most important question: "What are we actually trying to accomplish with social media?" The answer is never just "get more likes." We're talking about the big picture goals, like boosting brand awareness, bringing in quality leads, or making customers so happy they stick around for good.
Each of these objectives needs its own set of Key Performance Indicators (KPIs). The trick is to translate those broad business goals into specific, measurable metrics that tell you the real story of your performance.
From Business Objectives to Actionable KPIs
Imagine your main business goal this quarter is to drive more qualified leads for the sales team. A huge follower count looks great on paper, but it doesn't directly contribute to the bottom line. This is where we separate the vanity metrics from the ones that actually move the needle.
Instead of obsessing over follower growth, your report needs to spotlight KPIs that signal real interest from potential customers.
- Social Media Conversion Rate: Out of all the people who visit your site from social media, what percentage actually fills out a lead form? This is the gold standard.
- Click-Through Rate (CTR) on Lead-Gen Posts: Are people clicking on links to your gated e-books, webinar sign-ups, or demo request pages? This tells you if your content is compelling enough to spark action.
- Cost Per Lead (CPL): For paid campaigns, this metric cuts right to the chase, showing exactly how much it costs to get one new lead through the door.
This kind of focus turns your report from a simple summary into a strategic tool that directly supports business growth. To dig deeper into this, you can learn more about choosing the right social media metrics in our detailed guide.
A report’s true value is its ability to answer one simple question for stakeholders: "Is our social media investment paying off?" When you tie your metrics to goals, the answer becomes crystal clear.
Tailoring Metrics for Different Platforms
You wouldn't wear the same outfit to a black-tie gala and a backyard barbecue, right? The same goes for your social media KPIs. Each platform has its own vibe, audience, and purpose, and your metrics need to match. A one-size-fits-all approach just won't cut it; you'll miss out on crucial insights.
For example, if you're using LinkedIn for B2B lead generation and positioning your brand as an industry authority, you'd want to track:
- Engagement rates on your company page updates.
- Clicks from your posts back to your website or blog.
- Growth in followers who hold relevant job titles.
But over on TikTok, where the name of the game is often brand awareness and building a community, your focus would naturally shift to:
- Video view-through rates.
- The number of shares and saves your content gets.
- Mentions and uses of your branded hashtags.
By customizing KPIs for each channel, your social media analytics report will paint a far more detailed and accurate picture of what's working and where. To get this right, conducting a full social media marketing audit is a great way to align your metrics with your strategy. It’s an essential step for building a report that doesn't just track numbers but fuels smart decisions.
Building a Report That Tells a Clear Story
Alright, you've got your goals and KPIs locked in. Now comes the fun part: building the actual framework that turns all those numbers into a compelling story. The structure of your social media analytics report template is what makes the difference between a confusing spreadsheet and a powerful narrative that actually gets people to act.
Think of it like this: a report that just dumps data is like handing someone a pile of bricks. A well-structured report builds a house, guiding them from room to room. You want to lead your audience from a big-picture overview right down to the nitty-gritty details. This makes the information easy to digest and ensures your key points hit home.
Start with an Executive Summary
Every single good report I've ever seen starts with an Executive Summary. This is your quick, high-level snapshot. It’s written for the busy executive or client who might only have 60 seconds to spare.
This isn’t just an intro; it’s the trailer for your movie. It has to hit the most important plot points: your biggest wins, the most notable challenges, and a quick look at how you performed against your main goals. A sharp summary means even the busiest person walks away with the essential takeaways.
Key Takeaway: Your report needs to answer three questions: What happened? Why does it matter? And what should we do next? The structure should walk your reader through this journey, ending with clear actions.
Break Down Performance by Platform
Once you've set the stage with the summary, it’s time to zoom in on each social media platform. This is where you get into the weeds, but in a smart way. Don't just list the same metrics for every channel. Each platform has its own purpose, so your analysis should reflect that.
For instance, your LinkedIn section might highlight:
- Engagement Rate on your recent company culture posts.
- Click-Through Rates (CTR) on links to your new white paper.
- Follower growth from your target industries.
This specific approach tells a much richer story. It demonstrates that you know a winning TikTok strategy is worlds apart from a successful LinkedIn strategy, which leads to smarter, more effective decisions.
Mix Hard Data with Human Insights
Numbers tell you what happened, but they almost never tell you why. This is where your human expertise is invaluable. Your template needs a dedicated space to add context and interpretation right next to the data points.
- The Data (Quantitative): "Our best post this month got 5,000 likes and 500 shares."
- The Story (Qualitative): "This was the behind-the-scenes video of our team volunteering. It tapped directly into our audience's appreciation for authenticity, which clearly resonated."
This combination of numbers and narrative is what makes a report truly valuable. It’s the story behind the stats that provides real insight. This focus on explaining data is a huge reason the social media analytics market is set to explode, projected to hit USD 43.25 billion by 2030. You can get more details on this from Grand View Research's market analysis.
And don't just focus on the wins. Make sure to analyze what didn't work. I've often learned more from a flop than a viral hit. By building this structure into your template, it becomes more than a reporting tool—it becomes your engine for getting better every single month. For more on this, check out our guide to the fundamentals of social media analytics.
Choosing the Right Tools to Automate Reporting
Let's be honest: manually pulling data for your social media reports is a recipe for burnout and human error. If you're spending hours exporting CSVs and plugging numbers into a spreadsheet, you're not spending that time on what actually moves the needle—analyzing the data and making smart strategic decisions.
The right tool can completely change the game, turning a tedious chore into an efficient, automated process. But the key is finding a tool that fits your specific needs. A massive, enterprise-level platform is overkill for a small business, while relying solely on native analytics will hold back an agency managing multiple clients. It all starts with a clear look at your budget, team size, and what you truly need to report on.
The global social media analytics market is already valued at around $14.17 billion, and that number is growing. Why? Because businesses are realizing that cloud-based software is the key to unlocking efficient, scalable reporting. Automating data collection isn't just a time-saver; it's a competitive advantage.
Key Tool Categories to Consider
There's a whole spectrum of tools out there, and they aren't all created equal. Your choice really boils down to how deep you need to go with your reporting.
- Native Analytics Platforms: Think Meta Business Suite or LinkedIn Analytics. These are free, built-in tools that give you a solid baseline. They're perfect for getting your feet wet and understanding platform-specific performance without any extra investment.
- All-in-One Social Media Management Tools: This is where you find platforms like Sprout Social or Hootsuite. They are a huge step up, pulling data from all your channels into one place. Features like scheduled, automated reports and customizable templates are standard here.
- Specialized Analytics and Listening Tools: For the really deep dives—like comprehensive competitor analysis, sentiment tracking, and spotting industry trends—you'll want a specialized tool like Brandwatch. These go far beyond standard vanity metrics to give you powerful market intelligence.
This comparison chart breaks down how key metrics can vary between two of the most popular platforms, showing why a unified reporting tool is so valuable.
As you can see, a brand might find that while Instagram drives a higher engagement rate, Facebook delivers more consistent follower growth and supports a higher posting frequency. Without a central dashboard, you might miss this nuance.
A Comparison of Social Media Reporting Tools
To help you pick the right solution for your team, here's a quick breakdown of the different tool categories and what they're best suited for.
| Tool Type | Best For | Pros | Cons |
|---|---|---|---|
| Native Analytics | Beginners, small businesses, or those on a tight budget. | Free to use, accurate platform-specific data, no learning curve. | Limited to one platform, no cross-channel analysis, manual data pulling required. |
| All-in-One Platforms | Most SMBs, marketing teams, and agencies. | Centralized dashboard, automated reporting, time-saving features. | Can be costly, may have a steeper learning curve, might lack deep-dive analytics. |
| Specialized Tools | Large enterprises and data-focused teams. | Deep competitive insights, sentiment analysis, trend-spotting. | Very expensive, often complex, can be overkill for standard reporting needs. |
Ultimately, the best tool is the one that gives you the data you need without overwhelming you with features you'll never use.
Must-Have Automation Features
When you're comparing tools, don't just look at the price tag. Focus on the features that will solve your biggest reporting headaches. Can you build custom dashboards that spotlight your most important KPIs? Can you schedule reports to be automatically emailed to stakeholders at the first of every month?
A great automation tool shouldn't just pull numbers. It should help you build your report, visualize trends, and integrate seamlessly with your other marketing software. This is the foundation of a scalable and accurate reporting system.
Solid integration capabilities are non-negotiable. A tool that connects with Google Analytics can give you a much clearer picture of the entire customer journey, from social media click to website conversion. Looking for more ways to boost efficiency? Exploring a few business process automation examples can spark ideas for streamlining tasks across your entire department.
Choosing the right tech stack is about more than just convenience. It ensures your data is accurate and lets you finally step away from tedious data entry to focus on strategy.
Presenting Your Data for Maximum Impact
You've put in the work to build a fantastic report template. That's the setup. Now for the main event: presenting your findings in a way that actually makes people listen. A report full of incredible data is worthless if it doesn't lead to action.
This is your moment to step out of the analyst role and become a storyteller. Your job isn't just to list off numbers; it's to weave them into a narrative that explains what happened and why it matters. This is how you turn a routine update into a strategic conversation that gets everyone, from your content creators to the C-suite, excited about what's next.
Know Your Audience, Tailor Your Story
One of the biggest mistakes I see is people presenting the exact same report to everyone. Your CEO simply does not care about the same things your content team does. If you don't tailor your delivery, you’re guaranteed to see someone's eyes glaze over.
Think about who you're talking to and what keeps them up at night.
Talking to the C-Suite? Get straight to the point. They live and breathe the bottom line. Focus on big-picture results like Return on Investment (ROI), how social media is driving leads and sales, and the overall health of the brand's reputation. Keep it brief, visual, and directly tied to business objectives.
Meeting with the Marketing Director? They need to see how your work connects to the bigger marketing picture. Show them how social is driving traffic to the website, the conversion rates from social channels, and how specific campaigns are stacking up against your goals.
Huddling with the Content Team? This is where you can get into the weeds. They need tactical, actionable feedback. Dive deep into which posts flew and which ones flopped. Talk about the content formats that are getting all the love and any interesting patterns in audience engagement. This is the time to celebrate creative wins and pinpoint what to try next.
Don't Just State the Numbers—Explain Them
The most valuable real estate in your social media analytics report template is the "notes" or "commentary" section. This is where you connect the dots and turn raw data into genuine insight. Never, ever just repeat a number that's already in a chart.
Instead of saying, "Our engagement rate was 3%," tell the story behind it. Try something like, "We hit a 3% engagement rate this month, which is a 15% jump from last month. This was almost entirely driven by our new 'behind-the-scenes' video series, confirming our hypothesis that our audience wants more authentic, unpolished content."
See the difference? That simple shift from what to why is everything. It shows you're not just a data collector; you're a strategist who learns and adapts. This level of analysis is much easier when your data is organized for you. Many powerful social media reporting tools can automate the number-crunching, giving you more time for this critical thinking.
Let Visuals Do the Heavy Lifting
Let's be honest, nobody enjoys staring at a spreadsheet. We're visual creatures. A dense page of numbers feels like a chore, but a clean, simple chart can tell a story in a single glance. Use visual design to guide your audience's attention right where you want it.
A few simple tricks I always use:
- Consistent Color-Coding: Use green for good news (growth, high performance) and red for bad news (declines, underperformance). This makes the report instantly scannable.
- Simple Chart Notes: Don't make them hunt for the story. Add a small arrow or text box directly on a chart to explain a sudden spike. A quick note like "New campaign launch" next to a surge in traffic gives immediate context.
- Bold the Hero Metric: In any section, make the single most important number bold. It's a simple trick that ensures their eyes go straight to the main takeaway.
When you present your data this way, your report transforms. It stops being just a document and becomes a tool that drives smarter decisions and real, measurable growth.
Common Questions About Social Media Reporting
Even with a killer template, you're going to have questions. It just comes with the territory. Think of this as your personal FAQ, built from the kinds of questions I hear all the time from other social media managers. Let’s clear up some of the usual suspects.
How Often Should I Be Sending Out Reports?
This is probably the most common question I get, and the honest answer is: it depends entirely on who’s reading it and what you’re trying to achieve. There’s no magic number.
- Monthly reports are the bread and butter for most teams. It's the standard for a reason. You get a solid chunk of data to analyze real trends without drowning everyone in numbers. This is perfect for your regular updates with the marketing team or your direct boss.
- Weekly reports are for when things are moving fast. Got a big product launch? Running a critical, time-sensitive ad campaign? A weekly pulse check lets you stay agile and make quick adjustments on the fly instead of waiting a month to find out something isn't working.
- Quarterly reports are for the big picture conversations with executives or the C-suite. Here, you zoom way out. We're talking long-term growth, the overall return on investment (ROI), and how your social efforts are lining up with major business goals.
The trick is to match the report's timing to the audience's decision-making needs. You want to give them the right information at the right time.
What’s the Difference Between a Metric and a KPI?
Ah, a classic. Getting this right is what separates a "nice-to-have" report from a "must-read" one. It’s actually pretty simple when you break it down: all KPIs are metrics, but not all metrics are KPIs.
A metric is just a number. It’s a single data point. The number of likes on your latest Instagram post? That’s a metric. It tells you something, but without any context, it’s just noise.
A Key Performance Indicator (KPI) is a metric you've hand-picked because it directly shows how you're tracking against a specific business goal. Let's say your main objective is to generate leads. Your KPI isn't likes or reach; it’s the conversion rate from your social posts. That's the number that tells you if you're actually succeeding.
Think of it this way: Metrics are the individual words, but KPIs are the key sentences that tell your story. Your report should focus on those powerful sentences.
How Do I Report on "Softer" Things Like Sentiment?
This one feels tricky because you can't just slap a number on it and call it a day. Reporting on sentiment—how people feel about your brand—is part art, part science. It takes a mix of good tools and actual human insight.
Your first stop will likely be a social listening tool like Sprout Social or Brandwatch. They do a great job of automatically sorting brand mentions into positive, negative, or neutral buckets. This gives you a fantastic quantitative baseline. But don't stop there.
The real magic happens when you add your own qualitative analysis. Your report template should absolutely have a dedicated spot for this. This is where you:
- Pinpoint the main themes driving all that positive or negative feedback.
- Showcase a few specific customer comments (the good, the bad, and the ugly) to add real-world context.
- Explain why sentiment shifted. Did a new campaign cause a spike? Did a product issue cause a dip?
Doing this turns sentiment from a fuzzy concept into an incredibly powerful feedback loop that can inform everything from your content strategy to your customer service approach.
Ready to stop wrestling with spreadsheets and start telling a clear story with your data? With Publora, you can centralize your social media analytics, automate your reporting, and get back to focusing on strategy. Plan, schedule, and analyze your content across ten major networks from one intuitive dashboard. Try it free today and see how much time you can save. Start your 14-day free trial of Publora and take control of your social media management.
Related Articles

How to Measure Social Media Success
Go beyond vanity metrics. Learn to track data that directly ties to your business goals, from brand awareness to lead generation.

Mastering Social Media Return on Investment
Social media ROI is the harvest from your marketing efforts. Learn to measure real business value from your channels.
Mastering Content Performance Metrics
Think of metrics as a report card for every piece of content. Learn what hits, what misses, and why it matters.
A Simple Guide to Social Media Metrics
Learn the four core metric categories that answer fundamental questions about your social media performance and drive better decisions.